Test Automation brings speed, efficiency, reliability, and replicability to Software Testing-and is essentially inevitable in today’s Agile environment. We often discuss Test Automation, but there are few techniques that allow us to get an entirely unbiased opinion about it.
This is critical for Software Testing, where Automation’s effectiveness is constantly debated. Key Performance Indicators (KPIs) play a crucial role in measuring the effectiveness and accuracy of your team’s automated testing efforts. KPI’s can aid in improving your automated testing process and tracking its status. Additionally, by communicating KPIs, your executive team will have more clarity about what exactly Test Automation can achieve.
There are many different KPIs you can use. You do not need to use all of them; rather, choose those that best align with your business objectives. We chose 5 KPIs that we find quite universal and applicable to many industries and projects.

Get S.M.A.R.T with your KPIs – Follow these guidelines when creating KPIs
1. Percentage of Automatable Test Cases (Automation Index)
Not everything can be automated—nor does it need to be. A core hallmark of any organization’s testing strategy is prioritizing Automation for the test cases that will provide the biggest ROI. A “percentage of automatable test cases” KPI can be of great aid to teams new to Test Automation who may not know how to measure success. It also helps with establishing to outside stakeholders the priority teams have for automating the highly valued areas that will be automated, and what areas will still require manual and exploratory testing.
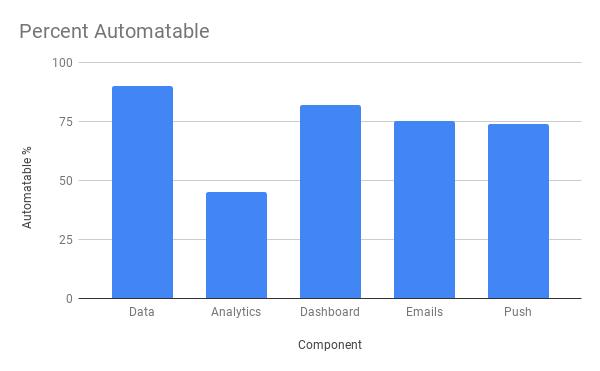
Once you know how much you can automate, only then can you measure your success. This KPI can be used to analyze what percentage of Automation can be done with various components within your product, then set the Automation goal.
| Percent automatable(%) = (# of automatable test cases / # of test cases) * 100 |
2. Automation Progress
This KPI enables you to track your progress towards your Automation goal. If your goal is to automate 100% of the “automatable” test cases, then this KPI is useful to track your progress towards the goal over time. This helps with establishing the cadence for doing in-sprint Automation.
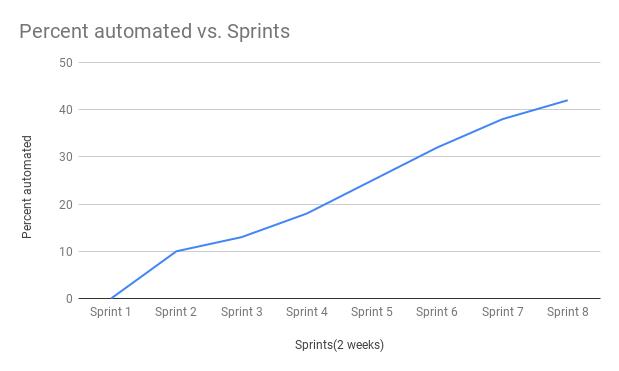
| Automation Progress = # of actual test cases automated / # of test cases that are automatable. |
3. Test Automation Coverage Levels
This KPI captures how much of your codebase is covered by all types of Automation. It can help to reveal parts of the software that do not have sufficient test coverage. The ideal amount of automated testing coverage should be based on your priorities and risk analysis.
Having an automated test coverage KPI enables you to quantify your Test Automation efforts. For example, you can set an Automation goal like, “Automated tests should achieve at least 80 percent of coverage.”
| PTC (%) = AC/C PTC = Percent of automated test coverage AC = Automation coverage C = Total coverage Total coverage means requirements, units/components, or code coverage |
4. Defect Removal Efficiency (DRE)
Defect Removal Efficiency (DRE) provides insights on your ability to identify and remove defects before production. DRE is the percentage of bugs caught by code reviews, unit tests, development testing, exploratory testing, and Test Automation. DRE essentially tells you how effective your team is at catching issues.
| DRE (%) = No of defects found and resolved during testing / No of defects found during testing + No of defects post release |
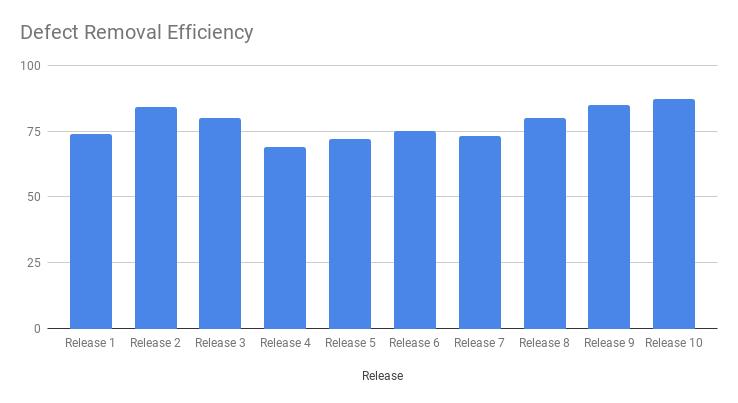
A good DRE to aim for is around 85%, and an excellent score is 95%.
Note – Automated tests usually do not have a high bug detection percentage. Automated tests are great candidates for regression testing and can ensure all existing functionality on a new release or a bug fix functions as expected. So Test Case Effectiveness and DRE KPIs have to be tracked sensibly for Automation efforts along with exploratory and manual testing efforts.
5. Equivalent Manual Test Effort (EMTE)
What effort it would have taken to execute the same automated tests manually? Equivalent Manual Test Effort is a simple “time savings” metric, which shows the benefit of running automated tests against the time it’d take to execute these tests manually.
How to calculate EMTE? (Dorothy Graham,2010)
For example:
If an automated test(1.1) takes 2 hours to be run manually then the EMTE is 2 hours.
If an automated test(1.2) takes 3.5 hours to be run manually then the EMTE is 3.5 hours
In a sprint, if automated test(1.1) is run twice and if automated test(1.2) is run thrice, then EMTE for that sprint is 22 hours+ 33.5 hours = 4+10.5 = 14.5 hours of EMTE.
We can say that Automation saved 14.5 hours of manual test efforts.
Summary
These KPIs represent a small subset of many possible Test Automation KPIs. KPIs are really useful if they are aligned with your Automation strategy and guide your strategic decision making. However, do not get too caught up with trying to hit positive goals. When a metric becomes a target, it ceases to be a measure! Getting expert help can aid you in the process of selecting the most useful KPIs for your Test Automation program. If you’re looking to implement Test Automation immediately, then let LogiGear assist you! For over 25 years, our Silicon Valley Testing Expertise has been helping companies leverage the benefits of Test Automation for a faster time-to-market while increasing their competitive advantage.

